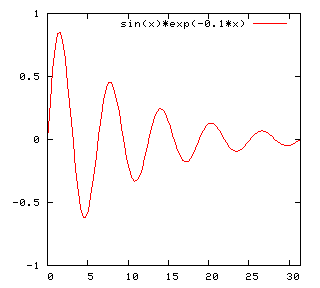
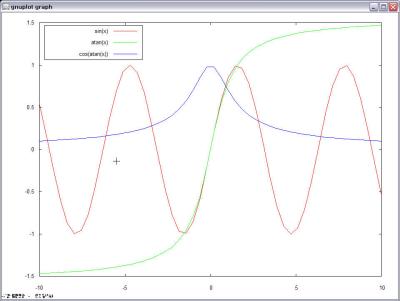
GNU Plot 은 편하게 사용할 수 있는 강력한 Plotting 도구이다. 이를 이용하여 2차원/3차원 그래프를 출력할 수 있다.
출력은 여러가지 형태로 가능하며 특히 LaTeX 을 위한 출력모드가 있다. 특히 LaTeX에 쓸 그래프 안에 한글이 필요하다면 epslatex으로 출력하는 것이 좋다.
[편집]
1 다운로드 및 동작확인 
- 다음의 위치에서 GNUPlot 을 다운로드 받는다. Linux용도 있고 Win32용도 있다.
- Unpack 한다음 특별한 Install 과정없이 원하는 디렉토리에 직접 Copy 한다.
- Path를 GNUPlot binary 파일이 있는 위치로 잡아 준다.
- 예를 들어서 D:\prog\gnuplot\binaries 를 PATH에 추가한다.
- demo 디렉토리로 가서, dem 파일을 아무거나 실행시킨다.
- 예를 들어서 wgnuplot simple.dem 하면 실행되고, 그래프를 보여준다.
- wgnuplot 을 stand-alone으로 사용할때 폰트의 크기가 너무작아서 보이지 않는데, 이때는 화면에 마우스 커서를 놓고, 우측 마우스 버튼을 누른다음, Choose Font를 선택하여 폰트의 크기를 키운다.
[편집]
2 일반 사용법 
- install 된 디렉토리의 docs에 gnuplot.pdf 파일이 있다.
- Introduction
![[http]](http://faq.ktug.org/wiki/imgs/http.png) http://www.cs.uni.edu/Help/gnuplot/
http://www.cs.uni.edu/Help/gnuplot/
- FAQ http://www.gnuplot.info/faq/
- gnuplot tips (not so Frequently Asked Questions) http://t16web.lanl.gov/Kawano/gnuplot/index-e.html
- 한글매뉴얼(http://wiki.kldp.org/KoreanDoc//html/GnuPlot-KLDP/)
[편집]
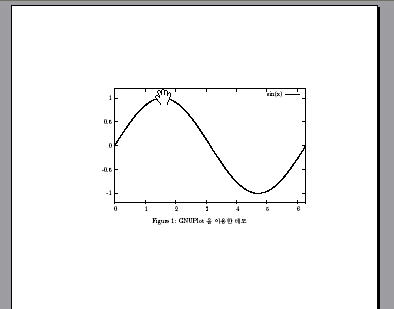
3.1 Gnu plot(plt) 소스파일을 만든다 
- . 다음과 같이 GNUPlot 소스파일을 만들고 test.plt 라고 하자.
- wgnuplot test.plt 로 컴파일하면 hello.tex 이 만들어 진다.
set terminal latex
set output "hello.tex"
plot [0:2*pi] [-1.2:1.2] sin(x)
[편집]
3.2 LaTeX 소스 파일을 만든다. 
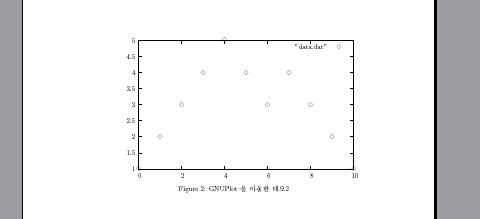
\documentclass{article}
\usepackage{hfont}
\begin{document}
\begin{figure}[htb]
  \centering
    \input{hello.tex}
  \vspace{-.3in}
  \caption{GNUPlot 을 이용한 데모}
  \label{plt:testplt}
\end{figure}
\end{document}
[편집]
5 LaTeX에서의 사용법 (3) : gnuplottex 
gnuplot 코드를 직접 LaTeX 소스에 써넣어서 그림으로 포함시키는 방법.
실행시에 --shell-escape 옵션을 준다.
\documentclass[a4paper]{article}

\usepackage[pdf]{gnuplottex}

\begin{document}

\begin{gnuplot}[width=.3\textwidth]
        plot sin(x)
\end{gnuplot}

\begin{gnuplot}
        set grid
        set title 'gnuplottex test'
        set ylabel 'y'
        set xlabel 'x'
        plot exp(x) with linespoints
\end{gnuplot}

\end{document}
#> pdflatex --shell-escape example