KTUG FAQ


Let a fool hold his tongue and he will pass for a sage.
GFaq&value=CygWin������ġ�ϱ� › 媛寃⑸; › TeXShop/PDFSync&value=LaTeX/FindPage › likesam&value=WinEdtTip/FindPage › Documents&value=KC2006 › GNUPlot
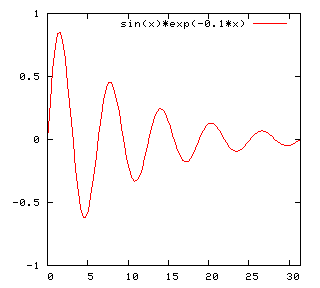
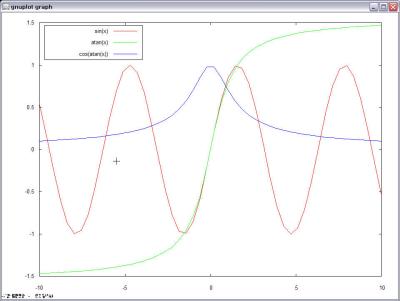
GNU Plot �� ���ϰ� ����� �� �ִ� ������ Plotting �����̴�. �̸� �̿��Ͽ� 2����/3���� ������ ����� �� �ִ�.
����� �������� ���·� �����ϸ� Ư�� LaTeX �� ���� ��¸�尡 �ִ�. Ư�� LaTeX�� �� ���� �ȿ� �ѱ��� �ʿ��ϴٸ� epslatex���� ����ϴ� ���� ����.
[����]
1 �ٿ�ε� �� ����Ȯ�� 
- ������ ��ġ���� GNUPlot �� �ٿ�ε� �´�. Linux�뵵 �ְ� Win32�뵵 �ִ�.
- Unpack ������ Ư���� Install �������� ���ϴ� ���丮�� ���� Copy �Ѵ�.
- Path�� GNUPlot binary ������ �ִ� ��ġ�� ��� �ش�.
- ���� �� D:\prog\gnuplot\binaries �� PATH�� �߰��Ѵ�.
- demo ���丮�� ����, dem ������ �ƹ��ų� �����Ų��.
- ���� �� wgnuplot simple.dem �ϸ� ����ǰ�, ������ �����ش�.
- wgnuplot �� stand-alone���� ����Ҷ� ��Ʈ�� ũ�Ⱑ �ʹ��۾Ƽ� ������ �ʴµ�, �̶��� ȭ�鿡 ���콺 Ŀ���� ����, ���� ���콺 ��ư�� ��������, Choose Font�� �����Ͽ� ��Ʈ�� ũ�⸦ Ű���.
[����]
2 �Ϲ� ���� 
- install �� ���丮�� docs�� gnuplot.pdf ������ �ִ�.
- Introduction
![[http]](/wiki/imgs/http.png) http://www.cs.uni.edu/Help/gnuplot/
http://www.cs.uni.edu/Help/gnuplot/
- FAQ http://www.gnuplot.info/faq/
- gnuplot tips (not so Frequently Asked Questions) http://t16web.lanl.gov/Kawano/gnuplot/index-e.html
- �ѱ۸Ŵ���
[����]
3.1 Gnu plot(plt) �ҽ������� ����� 
- . ������ ���� GNUPlot �ҽ������� ����� test.plt ��� ����.
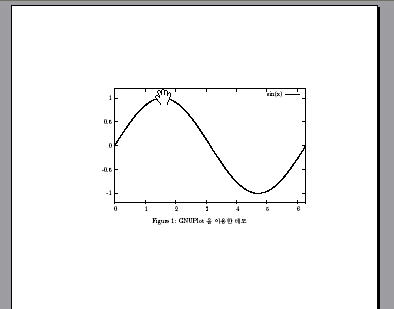
- wgnuplot test.plt �� �������ϸ� hello.tex �� ����� ����.
set terminal latex
set output "hello.tex"
plot [0:2*pi] [-1.2:1.2] sin(x)
[����]
3.2 LaTeX �ҽ� ������ �����. 
\documentclass{article} \usepackage{hfont} \begin{document} \begin{figure}[htb] \centering \input{hello.tex} \vspace{-.3in} \caption{GNUPlot �� �̿��� ����} \label{plt:testplt} \end{figure} \end{document}
[����]
4.1 ����� ������ ����� 
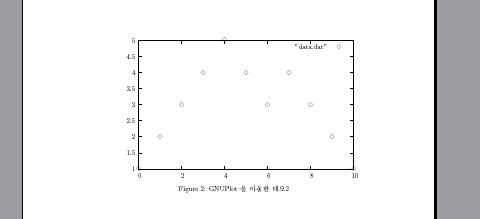
1
2
3
4
5
4
3
4
3
2
1
- �̶� ����Ϸ��� ������ data.dat �� �����ؾ� �Ѵ�.
[����]
4.2 Gnu plot(plt) �ҽ������� ����� 
set terminal latex
set output "hello2.tex"
plot "data.dat"
[����]
4.3 LaTeX �ҽ� ������ �����. 
- �̶� \Diamond ������ ���ǹǷ� \usepackage{latexsym} �� �߰��ؾ� �Ѵ�.
[����]
5 LaTeX������ ���� (3) : gnuplottex 
gnuplot �ڵ带 ���� LaTeX �ҽ��� ��־ ������ ���Խ�Ű�� ���.
����ÿ� --shell-escape �ɼ��� �ش�.
\documentclass[a4paper]{article}

\usepackage[pdf]{gnuplottex}

\begin{document}

\begin{gnuplot}[width=.3\textwidth]
        plot sin(x)
\end{gnuplot}

\begin{gnuplot}
        set grid
        set title 'gnuplottex test'
        set ylabel 'y'
        set xlabel 'x'
        plot exp(x) with linespoints
\end{gnuplot}

\end{document}
#> pdflatex --shell-escape example